This is part 3 of a series on improving performance. Click here for part 1, and here for part 2.
Now that the basics are done, it is time to start thinking more about testing. Some may say “but what happened to test first?” Well that is a long discussion, but suffice it to say that there must be a balance between testing and productivity.
Those that subscribe to assuring 100% test coverage I applaud your efforts. But unfortunately, your code will still contain bugs. Testing is VERY important. But apply it in a broader context and you will be more productive. I built tests that assure this very naive system works.
So what do we need to test here? Firstly, we must exercise as much of the code as possible. Then we can profile to see where the bottlenecks are. After all, this project is about profiling.
The rules of the game are “throw as many transactions at this thing as rapidly as possible.” But we also must be concerned about the quality of the data. In a real-world matching engine, the majority of transactions happen real close to the best bid and offer. But not everything happens there. So we need to generate a large amount of test data that will be processed in order. The end result should be a somewhat repeatable time. That data should include:
- Most (but not all) transactions close to the bid and ask
- A varying amount of quantity and price
- Price should not fall below zero (an upward bias perhaps?)
- Orders that partially fill
- Orders that take liquidity from several existing orders
There is functionality that does not exist. For example, this book does not provide for cancelling orders. It does not handle rounding (yet). So the test data will not include those things.
A very large CSV file was created with randomized data. Different tests will be created that limit the number of records processed. From that test, we can begin profiling to see which areas of code would benefit the most from further examination.
Tools
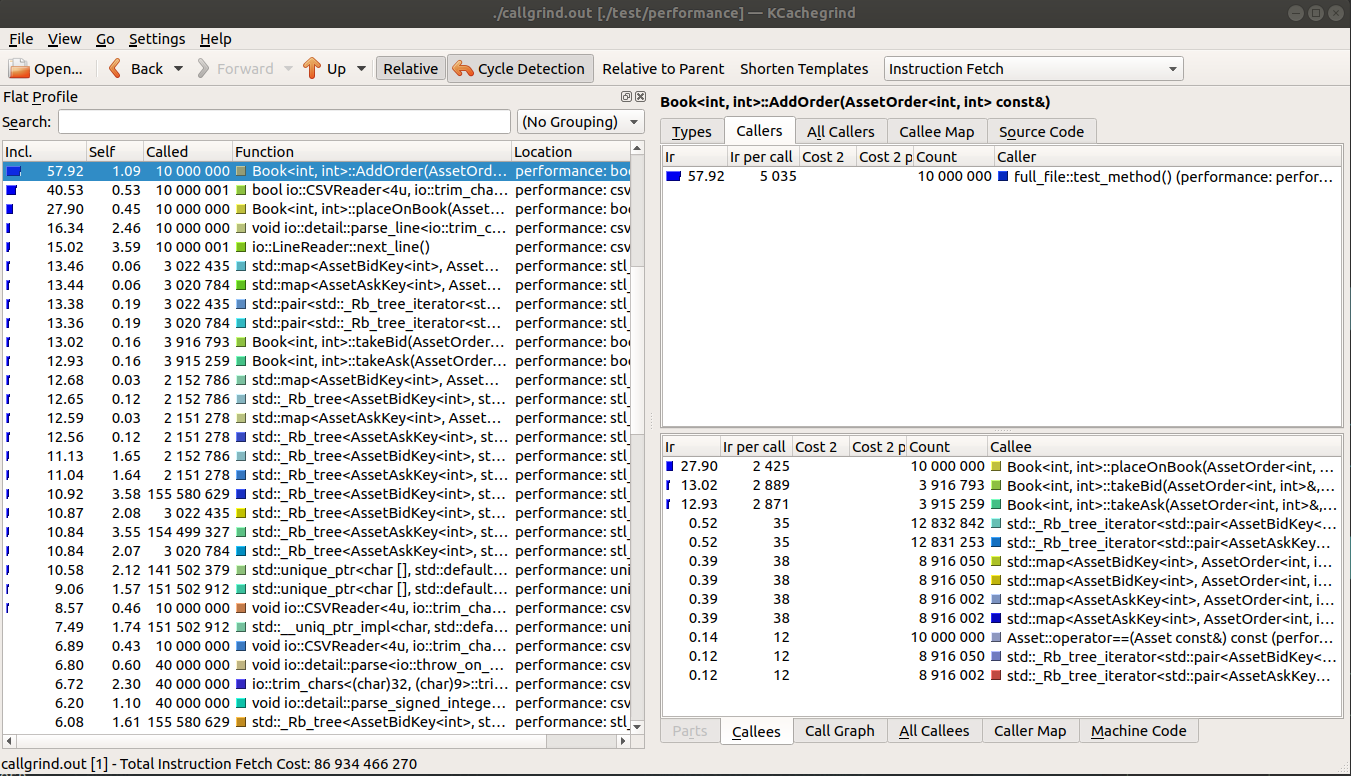
I will be using valgrind’s callgrind output to measure performance. kcachegrind will be used to help read the callgrind output.
Initial Results
Each time I profile a piece of code, I am somewhat surprised at the results. “No premature optimization” is alive and well. I had several assumptions before profiling. Some were valid, others do not seem to be so.
Firstly, the method “placeOnBook” took a good chunk of time. After a small amount of evaluation, it simply places an entry in the map. This area should be examined. I am thinking either there are copies or constructors that could be optimized or avoided altogether.
Secondly, the CSV Reader was high on the list. This is an example of how your test framework can show up in performance results. It doesn’t matter too much, as such results can be somewhat ignored. Optimization there is a waste of effort. But it does serve as an indication that the matching engine code is fairly robust.
Conclusion of Round 1
The std::map used is where effort should be put in. Keying differently, or replacing std::map with something faster will provide the best improvement. Here is a screenshot of the output, formatted by kcachegrind.